With the increase in drilling of unconventional natural gas wells in Pennsylvania over the past several years many sources have tried to map the phenomenon. One that is interactive and provides some useful breakdowns by county and municipality comes from State Impact Pennsylvania which uses Pennsylvania DEP data as its source.
Natural Gas Drilling in Pennsylvania
You will notice that Washington County, where were are located at Washington & Jefferson College, ranks third among PA counties with 896 wells drilled. The most intense drilling activity tends be occurring in the southwestern and northeastern parts of the state.
Saturday, March 30, 2013

Wednesday, March 20, 2013
Energy - How Is It Used?
The ways that we use energy are numerous.
Consider a normal day - wake up in a heated (or air conditioned) house, turn on the lights, plug in the coffee maker, make sure that your laptop and smartphone are charged, drive to work, enter an office with computer, printer, lighting, and heat (or AC) - the list could go on nearly endlessly.
How can be gain some clearer information about the different ways energy is used?
The US Energy Information Administration (EIA) classifies energy based on its end use. In 2011 the industrial sector accounted for 31 percent of all energy used in the US. The transportation sector accounted for 28 percent, the residential sector 22 percent, and the commercial sector accounted for 19 percent of usage.
While the transportation, residential, and commercial sectors have experienced consistent increases in consumption of energy, usage in the industrial sector has been relative flat since the early 1970s as the economy has been less dependent on manufacturing and as the sector has used energy more efficiently.

Consider a normal day - wake up in a heated (or air conditioned) house, turn on the lights, plug in the coffee maker, make sure that your laptop and smartphone are charged, drive to work, enter an office with computer, printer, lighting, and heat (or AC) - the list could go on nearly endlessly.
How can be gain some clearer information about the different ways energy is used?
The US Energy Information Administration (EIA) classifies energy based on its end use. In 2011 the industrial sector accounted for 31 percent of all energy used in the US. The transportation sector accounted for 28 percent, the residential sector 22 percent, and the commercial sector accounted for 19 percent of usage.
While the transportation, residential, and commercial sectors have experienced consistent increases in consumption of energy, usage in the industrial sector has been relative flat since the early 1970s as the economy has been less dependent on manufacturing and as the sector has used energy more efficiently.

Thursday, March 14, 2013
Ethanol Issues
The Associated Press had an informative article about the connections between corn harvests and ethanol production.
Given that corn is the main input in U.S. ethanol production, plentiful and cheap corn is essential. The drought of 2012, that heavily impacted major corn producing states, led to 20 of the nation's 211 ethanol plants stopping production. The drought led to lower corn yields and higher prices - these higher prices make ethanol production unprofitable. The AP article notes that approximately 10 percent of the nation's gas comes from ethanol but that the impacts of the plant shutdowns should be minimal due to large stocks of ethanol. If yields do not rebound in the coming years however the industry could be hit hard.
Increased production of ethanol is part of the reason that more energy in the U.S. has been sourced domestically over the past decade.
The chart below from EIA provides some specific data on the margins that ethanol plants are experiencing.

Given that corn is the main input in U.S. ethanol production, plentiful and cheap corn is essential. The drought of 2012, that heavily impacted major corn producing states, led to 20 of the nation's 211 ethanol plants stopping production. The drought led to lower corn yields and higher prices - these higher prices make ethanol production unprofitable. The AP article notes that approximately 10 percent of the nation's gas comes from ethanol but that the impacts of the plant shutdowns should be minimal due to large stocks of ethanol. If yields do not rebound in the coming years however the industry could be hit hard.
Increased production of ethanol is part of the reason that more energy in the U.S. has been sourced domestically over the past decade.
The chart below from EIA provides some specific data on the margins that ethanol plants are experiencing.
Monday, March 11, 2013
Energy Usage at a Macro Scale
One thing we can be sure of when it comes to energy - we use a lot of it. According to the US Energy Information Administration (EIA) the US used 97.5 quadrillion btus of primary energy in 2011.
That is 97,500,000,000,000,000
So where did all of this energy come from?
The largest primary energy source is petroleum which accounted for 36 percent of energy use in 2011. This is followed by natural gas at 25 percent, coal with 20 percent, renewables at 9 percent, and nuclear at 8 percent.
In future posts we will devote a bit more time to each primary energy source and consider how this usage has changed over time.
That is 97,500,000,000,000,000
So where did all of this energy come from?
The largest primary energy source is petroleum which accounted for 36 percent of energy use in 2011. This is followed by natural gas at 25 percent, coal with 20 percent, renewables at 9 percent, and nuclear at 8 percent.
In future posts we will devote a bit more time to each primary energy source and consider how this usage has changed over time.
Wednesday, February 27, 2013
Energy Lecture Series
Maggie Koerth-Baker will be visiting campus on Tuesday March 5, 2013.
Her talk is entitled "The Past, Present, and Future of America's Electric Infrastructure." This will be held in the Yost Auditorium inside the Howard J. Burnett Center at 6:30pm.
Maggie is the science editor for Boingboing.net - one of the most influential blogs in the country.
This lecture, like the others in the series, is free and open to the public.
Her talk is entitled "The Past, Present, and Future of America's Electric Infrastructure." This will be held in the Yost Auditorium inside the Howard J. Burnett Center at 6:30pm.
Maggie is the science editor for Boingboing.net - one of the most influential blogs in the country.
This lecture, like the others in the series, is free and open to the public.
Thursday, February 7, 2013
Energy in Our World
Consider the various ways that we use and interact with energy sources everyday - burning gasoline to drive to work or school, relying on electricity to power all our gadgets, using natural gas to heat our homes and businesses. Where does all of this energy come from and how much of it is produced within the US?
These questions, and more, are central to the Washington & Jefferson College Energy Index.
In its simplest form the Index examines all energy consumed in the US and is able to provide a reliable and accessible measure of the share of this energy produced domestically. It also places our current energy situation in a historical perspective and allows for comparisons of regional differences with respect to energy consumption and production.
The chart below shows the percent of total energy consumed that was produced domestically. We see that the US produced nearly all of the energy it needed following WWII. It is also clear that as energy demands grew over time an increasing share of the energy used in the US was sourced from foreign countries. The two exceptions to this pattern of a decreasing domestic energy share are the late 1970s oil crisis and the present time period starting in the mid 2000s.
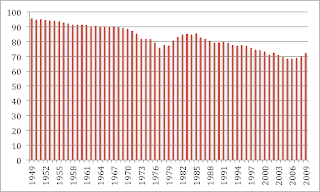
To return to our initial question - how much of the energy we consume is produced in the US - the answer currently is around three-fourths (75%). This is somewhat below the historical average but certainly is on the rise.
These questions, and more, are central to the Washington & Jefferson College Energy Index.
In its simplest form the Index examines all energy consumed in the US and is able to provide a reliable and accessible measure of the share of this energy produced domestically. It also places our current energy situation in a historical perspective and allows for comparisons of regional differences with respect to energy consumption and production.
The chart below shows the percent of total energy consumed that was produced domestically. We see that the US produced nearly all of the energy it needed following WWII. It is also clear that as energy demands grew over time an increasing share of the energy used in the US was sourced from foreign countries. The two exceptions to this pattern of a decreasing domestic energy share are the late 1970s oil crisis and the present time period starting in the mid 2000s.

To return to our initial question - how much of the energy we consume is produced in the US - the answer currently is around three-fourths (75%). This is somewhat below the historical average but certainly is on the rise.
Subscribe to:
Posts (Atom)